

ANIQSpec Spectroscopy Software
 One analysis, according to a specific set of parameters, is called a series, and the result
of an analysis is a single number or data point for each counting interval. Up to 100
series may be analysed at the end of each interval. Thus the data set comprises a matrix
of rows and columns, where each column is a series, and each row is a counting interval.
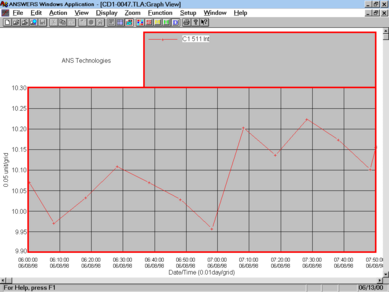
The series data is continually updated which allows the user to monitor on-line the evolution
of wear or corrosion from a number of components simultaneously.
One analysis, according to a specific set of parameters, is called a series, and the result
of an analysis is a single number or data point for each counting interval. Up to 100
series may be analysed at the end of each interval. Thus the data set comprises a matrix
of rows and columns, where each column is a series, and each row is a counting interval.
The series data is continually updated which allows the user to monitor on-line the evolution
of wear or corrosion from a number of components simultaneously.
 Besides series extracted from the MCA data, ANSWERS is also equipped to control,
analyse & create series from our ANIQIO board. This data would normally include
operating parameters of the machine itself, such as temperatures, pressures or speeds.
Besides series extracted from the MCA data, ANSWERS is also equipped to control,
analyse & create series from our ANIQIO board. This data would normally include
operating parameters of the machine itself, such as temperatures, pressures or speeds.
ANIQMCA is designed to acquire spectral data in single periods, and display the spectrum in graphical mode. It controls and downloads data from the ANIQSpec Spectroscopy Modules. ANIQMCA allows the user to open a number of documents, limited only by the memory of the PC. Each document is a histogram with an array size of either 1024, 2048 or 4096 channels. Each channel contains an integer from 0 to 232.
The user may create on-line documents, one for each board. Such documents may be used to acquire live data. Since the ANIQSpec boards acquire data independently, acquired data may be recovered when ANIQMCA is started. The data may be saved on disk in an MCA file, which may be read as an off-line document and analysed.

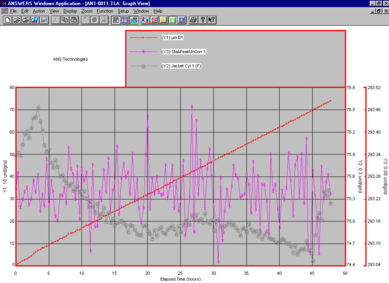
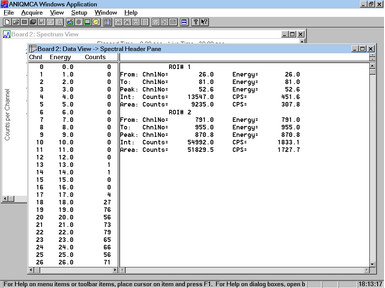
The data may be viewed graphically in the Spectrum View. There is a header that displays the True Time (TT), Live Time (LT) and percentage Dead Time (DT). If an energy calibration is in effect, the slope and intercept are also displayed.
The number of counts is autoscaled, but this may also be modified with the PageUp, PageDown and Home keys. The range may also be manually or automatically scaled, and there is a Zoom feature to view close-ups temporarily. The user may set up to ten Regions-of-Interest (ROIs) on the spectrum, used both to calibrate the energy, and to perform analysis of a photopeak contained therein.
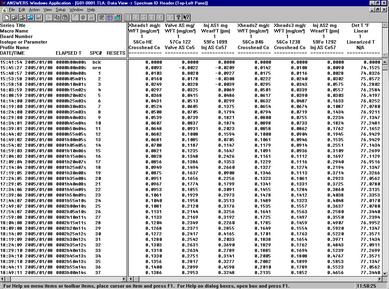
The Data View displays a table of the raw data, with columns for Channel Number, Energy and Counts, as well as ROI data.The Data View displays a table of the raw data, with columns for Channel Number, Energy and Counts, as well as ROI data.
ANIQMCA is also used to define, save and transmit certain parameters to the ANIQSpec Spectroscopy Modules. The parameters are sent to the board's memory, and control how the input voltage pulses are analysed.
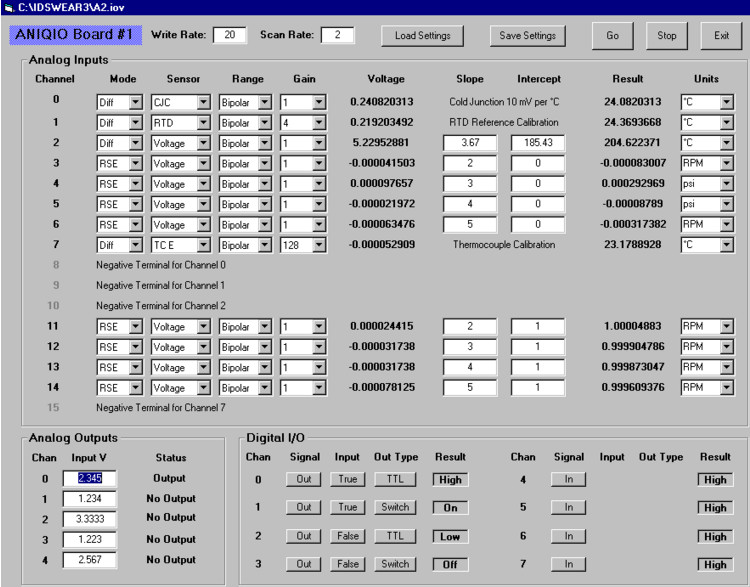
IOViewer is a general control, display and recording software for use with the ANIQIO board. Multiple instances of IOViewer may be called, one for each ANIQIO board present. A file with extension IOV is used to record the settings of the various I/O channels, as well as record the results of the periodic scan of the ANIQIO board attached.
The analog inputs are processed according to a set of input parameters. The "Mode" determines whether the inputs are to be configured as Referenced Single-Ended (RSE) or Differential (Diff). In the RSE mode, any channel's input voltage may be measured with respect to a common ground. In Diff mode, the input to Channels 0 to 7 may be measured with respect to Channels 8 to 15, respectively. The "Sensor" parameters determines which type of sensor is being used for that channel, be it a simple voltage signal, an RTD or one of five types of thermocouples. The voltage read from the board is displayed, as is a result based on a calibration. For thermocouples and RTDs, the calibrations are internal to IOViewer, and the result is in terms of temperature. For simple voltage signals, the user may enter a linear calibration and give a name to the units.
The user may output a voltage via one of five AO channels. Within IOViewer, one merely enters the voltage in the box, and hit return. The appropriate voltage is output.
For each of eight digital I/O channels, the user first selects the "Signal", be it input or output. If output is selected, the user may select the "Out Type" for that channel, be it TTL or switch, and the desired results, either TRUE or FALSE. If "Out Type" is TTL, TRUE sends a 3.3 volt level, otherwise a zero volt level. If "Out Type" is Switch, TRUE turns on the switch, false turns it off. For both Output and Input, the result is shown at each scan.